The Electrostatic Tools were used in the research of the anisotropy of sulfur atoms. A set of models were constructed and analysed in terms of precision and future perspectives.
In this project the Electrostatic Tools were used as a primary research tool to fit the multipole models and estimate their errors. The Electrostatic Tools script bindings were extensively used to create scripts for visual error analysis.
You can reproduce the results obtained with
the set of files provided. We assume, that the
Electrostatic Tools
with Python3 bindings are installed in the system and are available in PATH.
The BASH scripts also rely on Python3, Perl, and AmberTools present in the system.
After downloading and unpacking, you will find a directory and a set of files in this archive:
- scripts is a directory, containing all the scripts needed for model ftting and visual error analysis.
- mol1.mol2 .. mol5.mol2 are files with furan, thiophene, thiazole, dimethylsulfide, and dimethyldisulfide structures generated with OpenBabel.
- mol1.4c5l.esp .. mol5.4c5l.esp are files with a reference molecular electrostatic potential (MEP) calculated at the RHF/6-31G* level of theory.
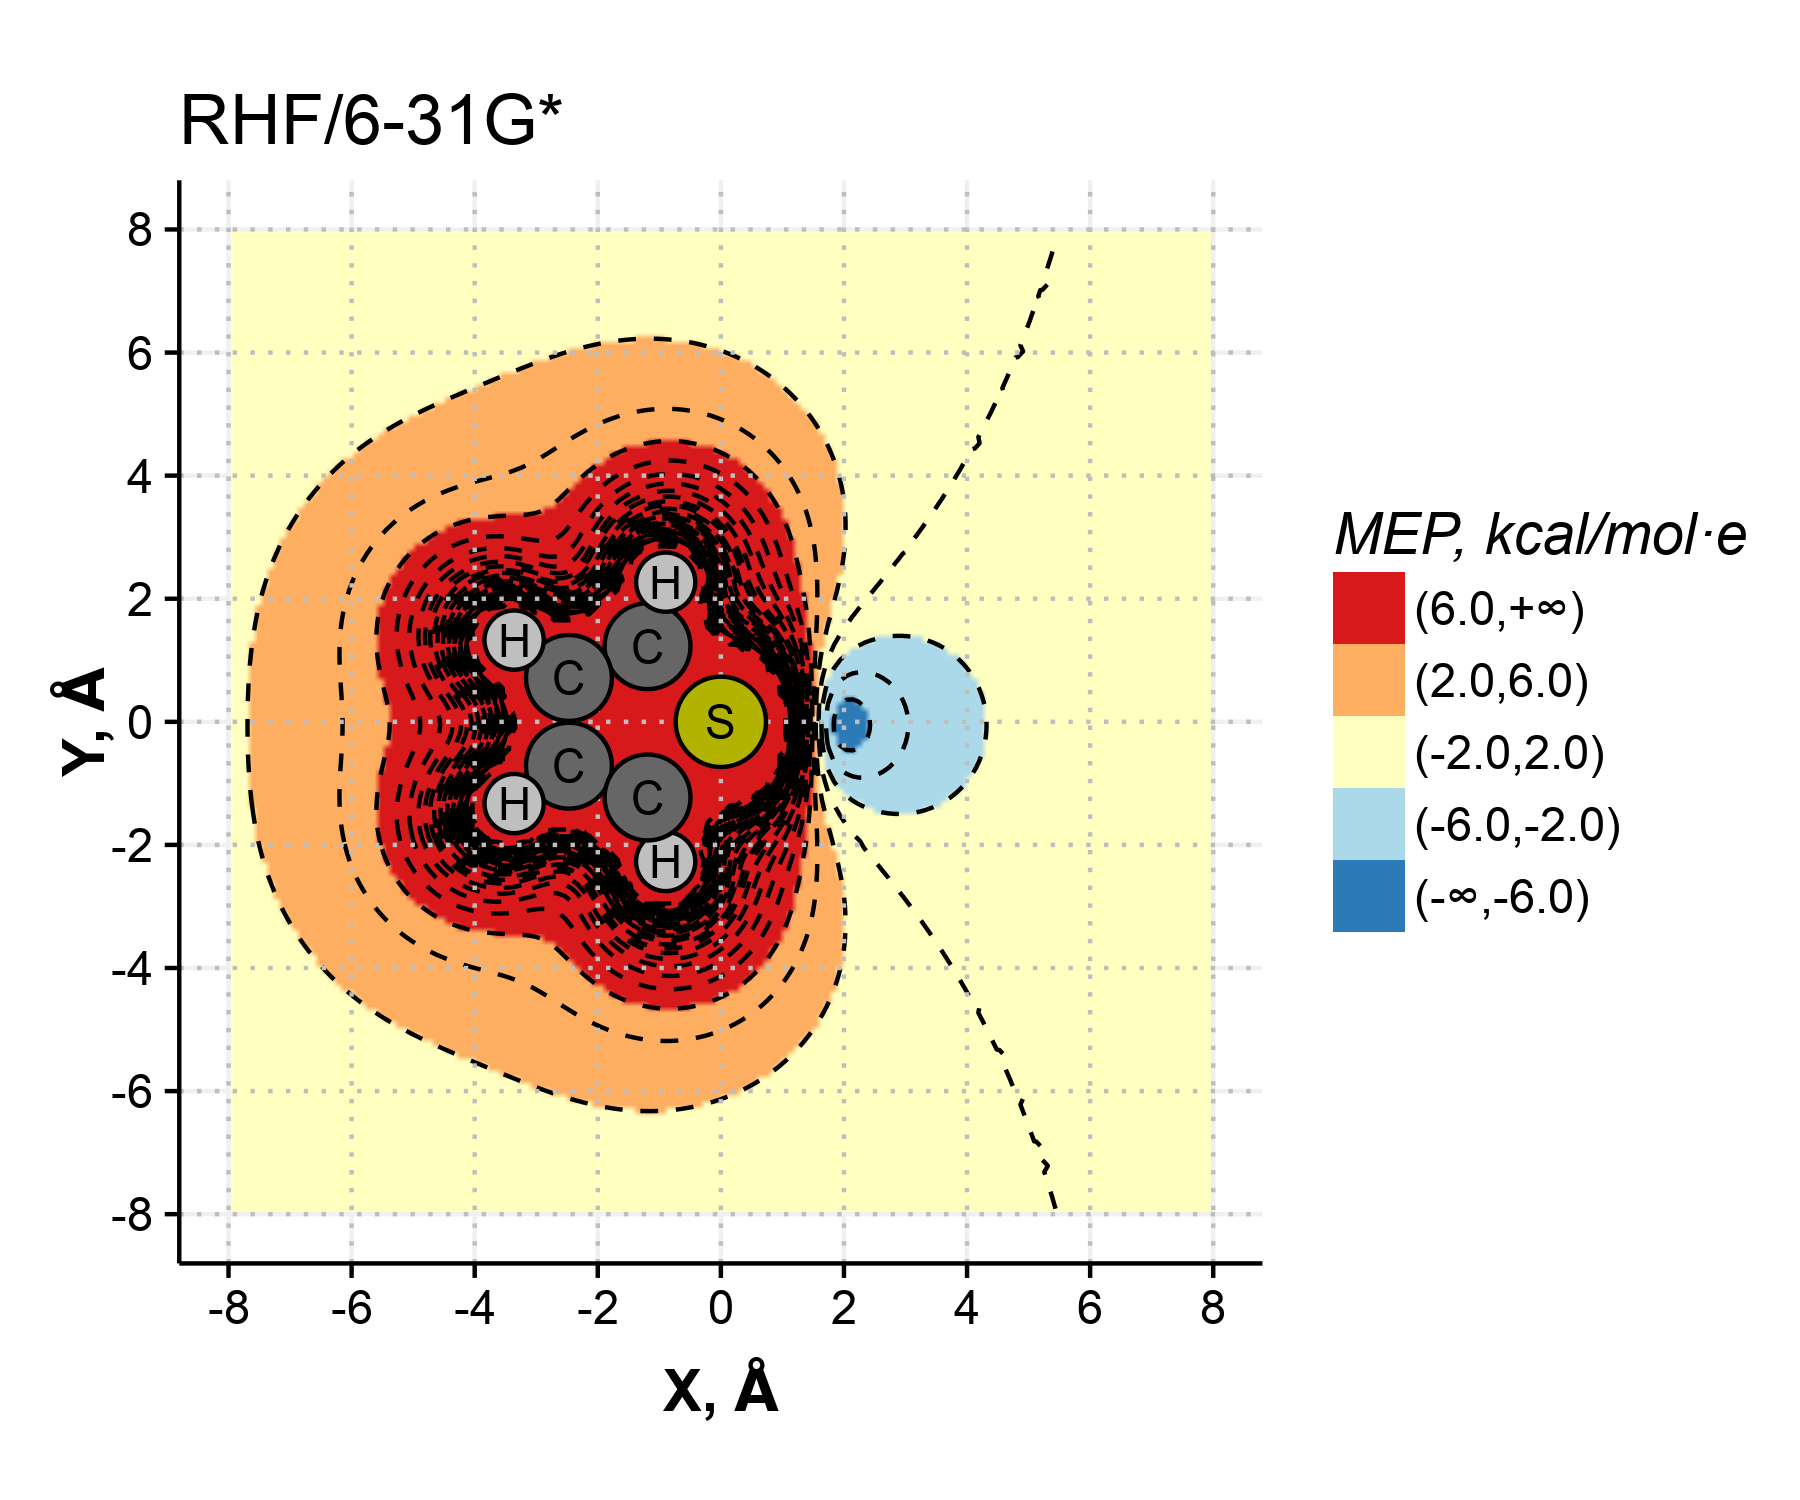
- mol1.grid1.esp .. mol5.grid1.esp and mol1.grid2.esp .. mol5.grid2.esp are files with reference grids with RHF/6-31G* MEP. The grid1s are grids in the plane of the C-S-C atoms, the grid2s are perpendicular and contain the symmetry axis of the C-S-C fragment.
To fit the models investigated run the scripts/get_results.sh script.
scripts/get_results.shIt creates the corresponding rulefiles for the
mult_fitter and uses it to fit the
multipole models. Tha RESP and AM1-BCC models are generated with resp (through
our helper scripts) and antechamber programs for AmberTools package.
After the models are built, the MEP error on the 4c5l grids is estimated with the help of
mep_rmsd program. The results are saved in the results.txt file.
To visually analyse the models you can use the scripts/get_grids.sh script.
scripts/get_grid.sh mol2/mol2.mdzq.mmol mol2.grid1.esp mol2.mdzq \
"\"RHF\/6-31G\*\"" \
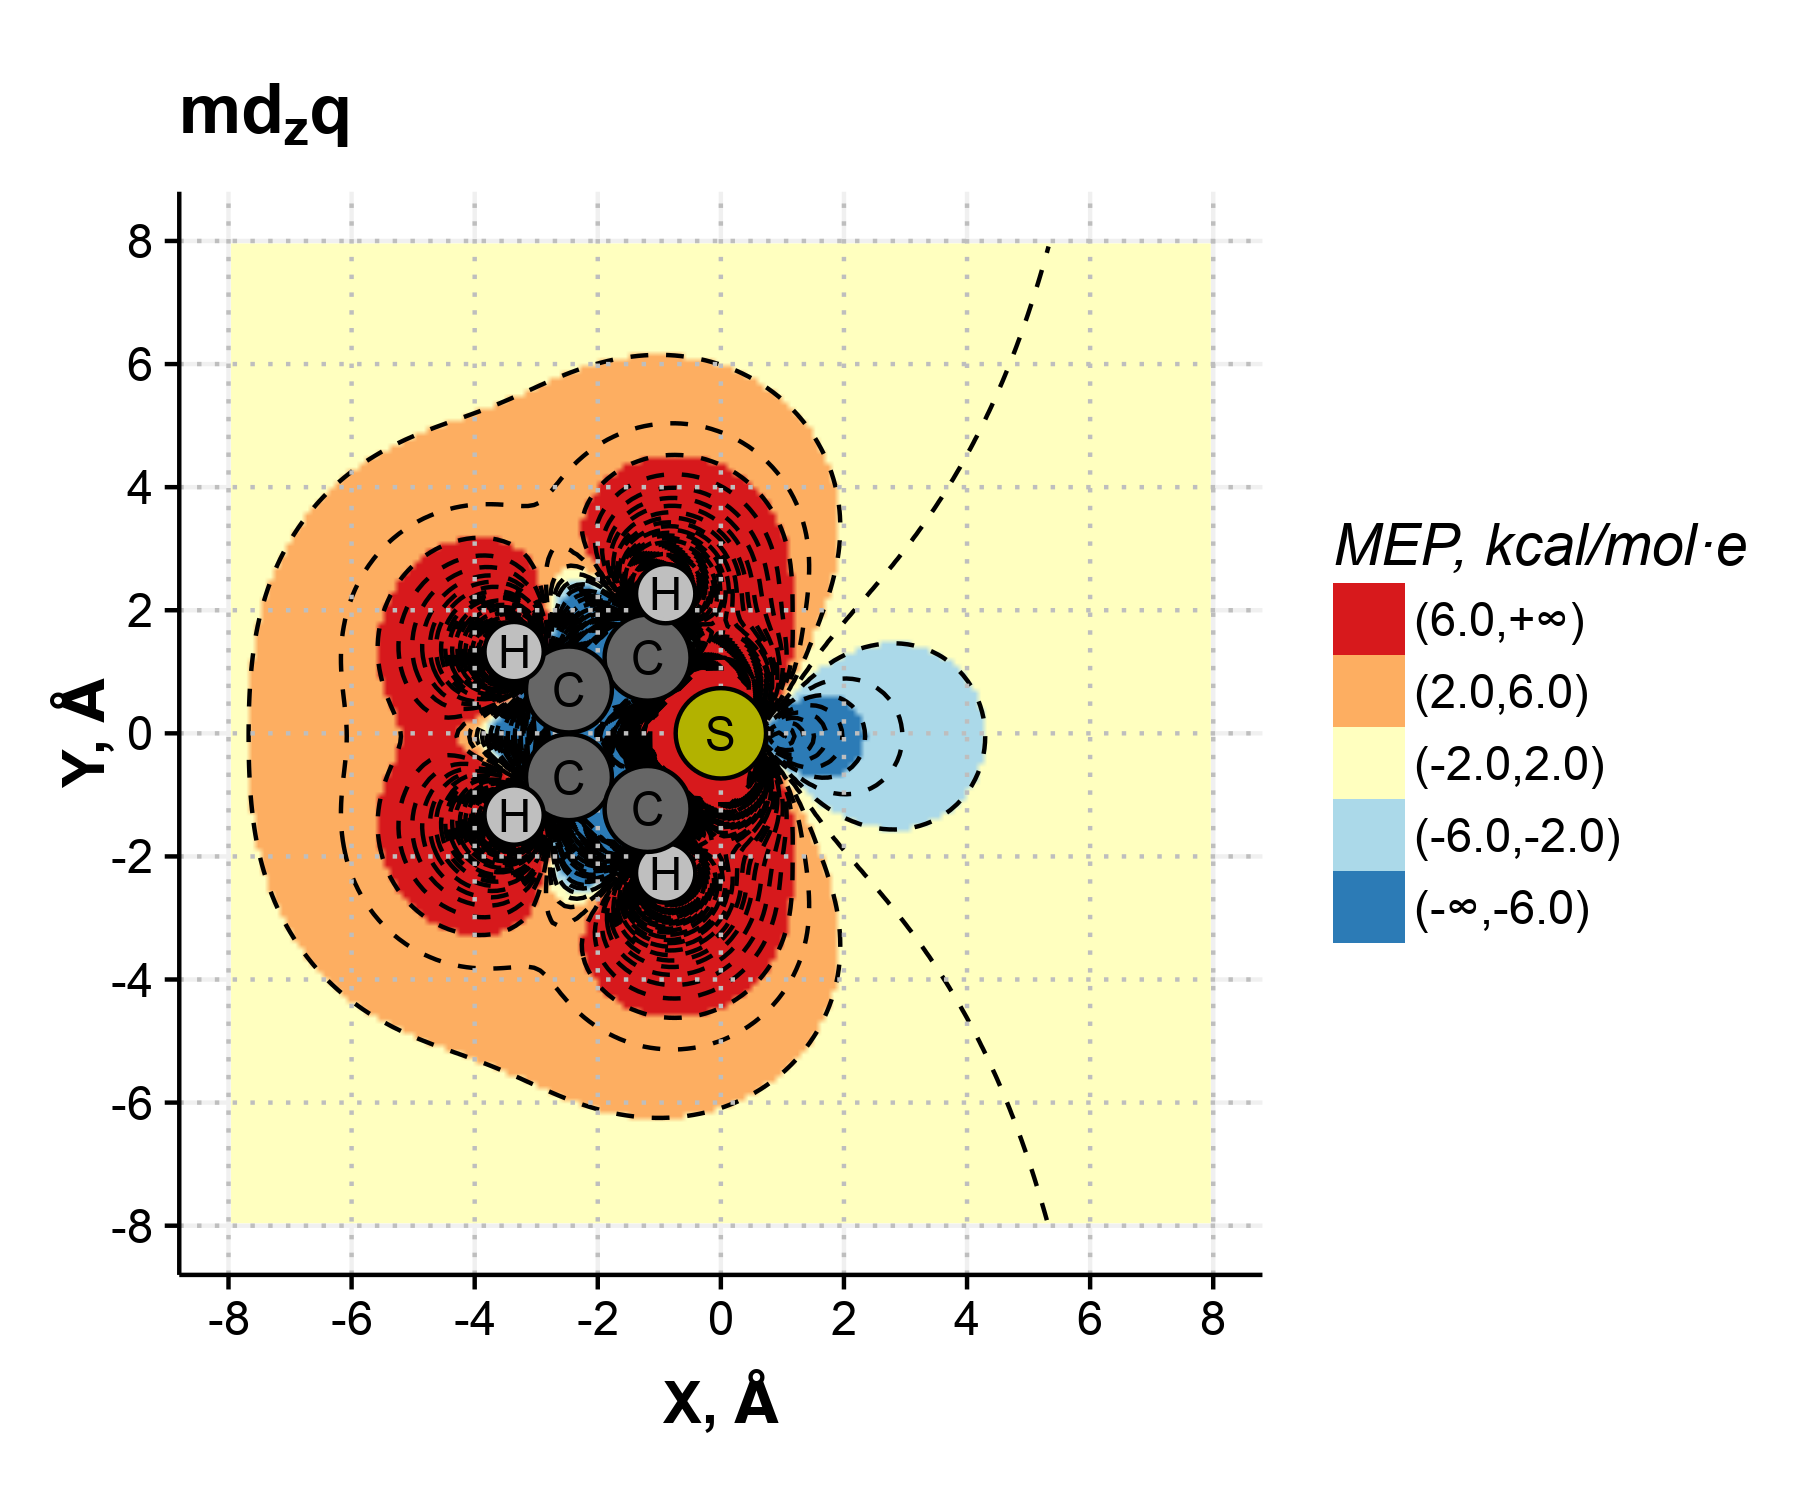
"expression(bold(\"md\"[z]*q))" \
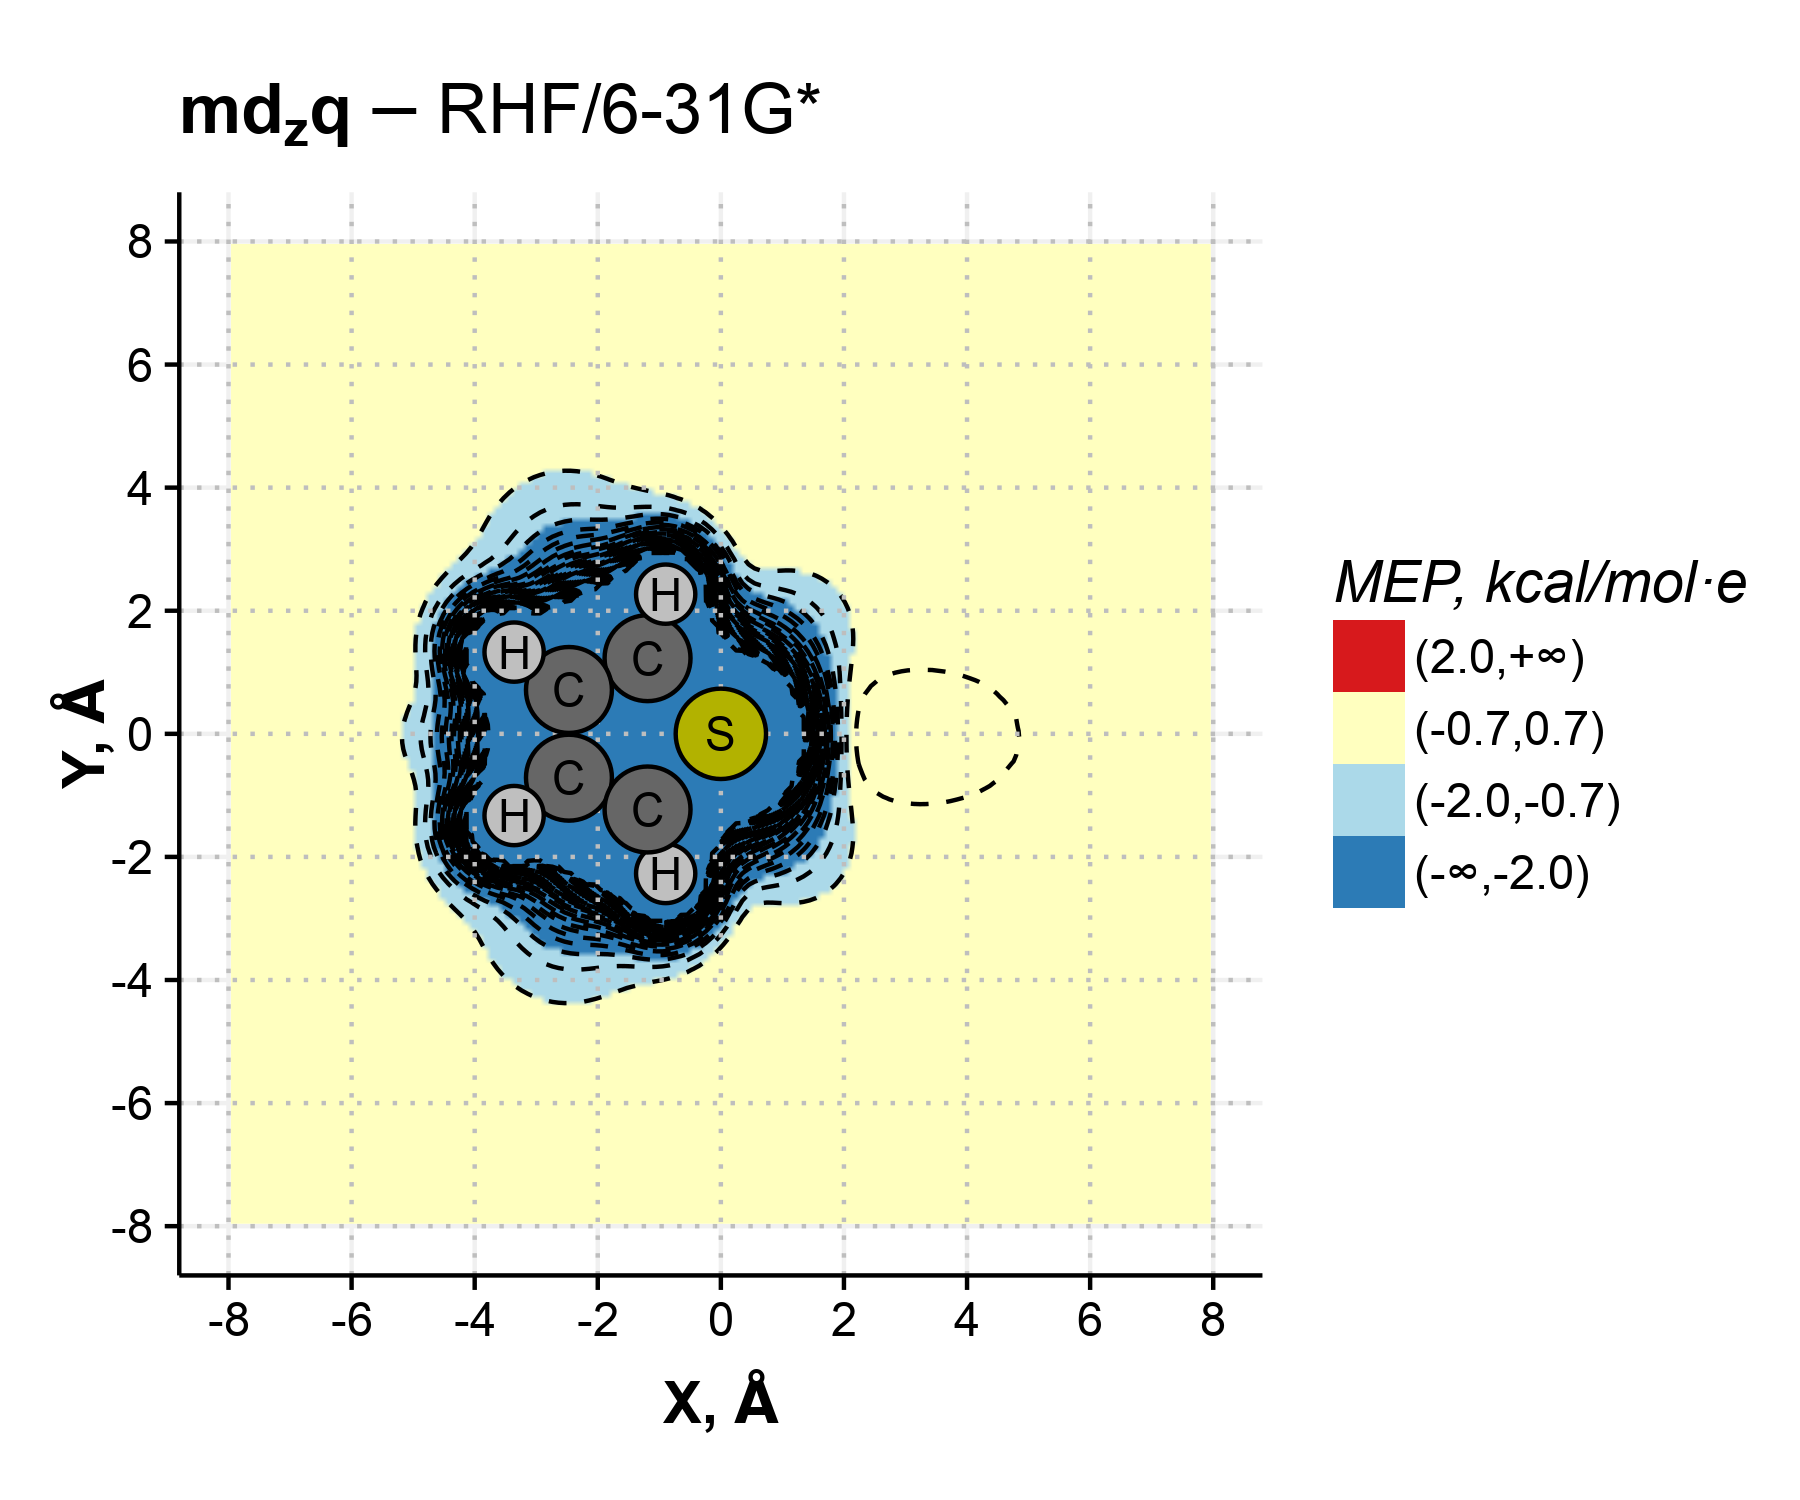
"expression(bold(\"md\"[z]*q) - \"RHF\/6-31G\*\")" \
6 6 2 8
This call looks like a really complicated one, however it is not.
The script requires 10 positional arguments: a molecule file in a mmol format,
a grid file with a reference grid, a picture file prefix for output, names to put on the graphs
for reference MEP, model MEP, and MEP error, a value of MEP to use as reference for colorful legend for
reference MEP, model MEP, and MEP error, and the width of the grid XY area on the plot.
The command above will plot 3 pictures (see below) with the refence MEP, the MEP derived from the
mdzq model,
and its error. The main complication comes from the fact, that scripts/get_grids.sh
uses sed as a preprocessor to directly insert the R code for the plot titles to achieve
the fancy formatting, so the arguments for plot titles need to contain a valid R code (see the
backslashed quotes or the expression() call).
Feel free to experiment and look at the other models.